- The researchers project 17 GW of new solar capacity in Africa in 2026, up 45% on their 2025 estimate.
- They estimate distributed solar supplied about three quarters of new capacity from 2023 to 2025.
- The approach estimates the lag between a panel being exported and being installed.
Inside this story 2 perspectives
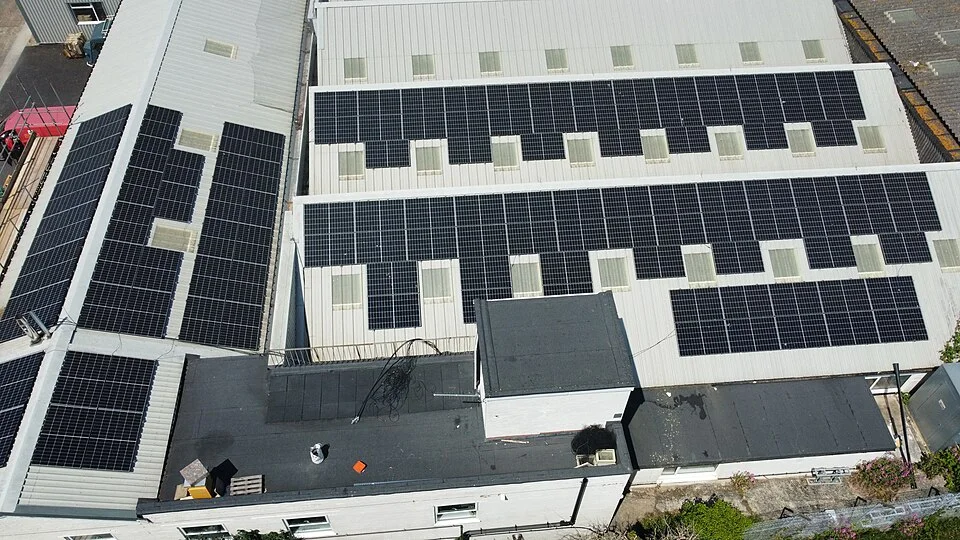
An electricity planner can usually find out when a large solar farm starts feeding the grid. A shop that puts panels above its storeroom presents a different problem. The shop may simply start drawing less electricity from the network during daylight. Its panels can be working perfectly while barely registering in national figures for new generating capacity.
On 27 August, African Tech Futures Lab and energy research group Ember published an attempt to count some of that missing activity. They estimate African countries are on course to install 17 gigawatts of solar capacity this year, about 45 per cent more than their estimate for 2025. The calendar still has four months to run. One of the study’s earliest clues to what will happen in those months comes from a point far upstream of the electricity meter.
Following the modules
The researchers drew on Chinese customs data for solar-panel exports, available through June. They examined the relationship between shipments and installations in the European Union and five other markets. In those comparisons, about 73 per cent of exported panels typically reached installation within six months. Applying a model of that delay lets them estimate the capacity likely to have entered service in a destination country.
A panel can spend time in a warehouse, travel on to another market or be held up while an installer waits for another component. The relationship observed elsewhere will also fit some markets better than others. Those differences explain why an import figure cannot simply be copied into a table of working capacity. They also suggest a useful place to test the estimate wherever better local records become available.
The systems behind the meter
The researchers put distributed solar at about three quarters of African solar capacity additions between 2023 and 2025. Distributed systems include smaller installations close to the households or businesses using the power. Only 12 African countries have an official or semi-official estimate specifically covering distributed solar, according to the authors. The historical share is a separate calculation from their projection of how much new capacity all types of installations will add this year.
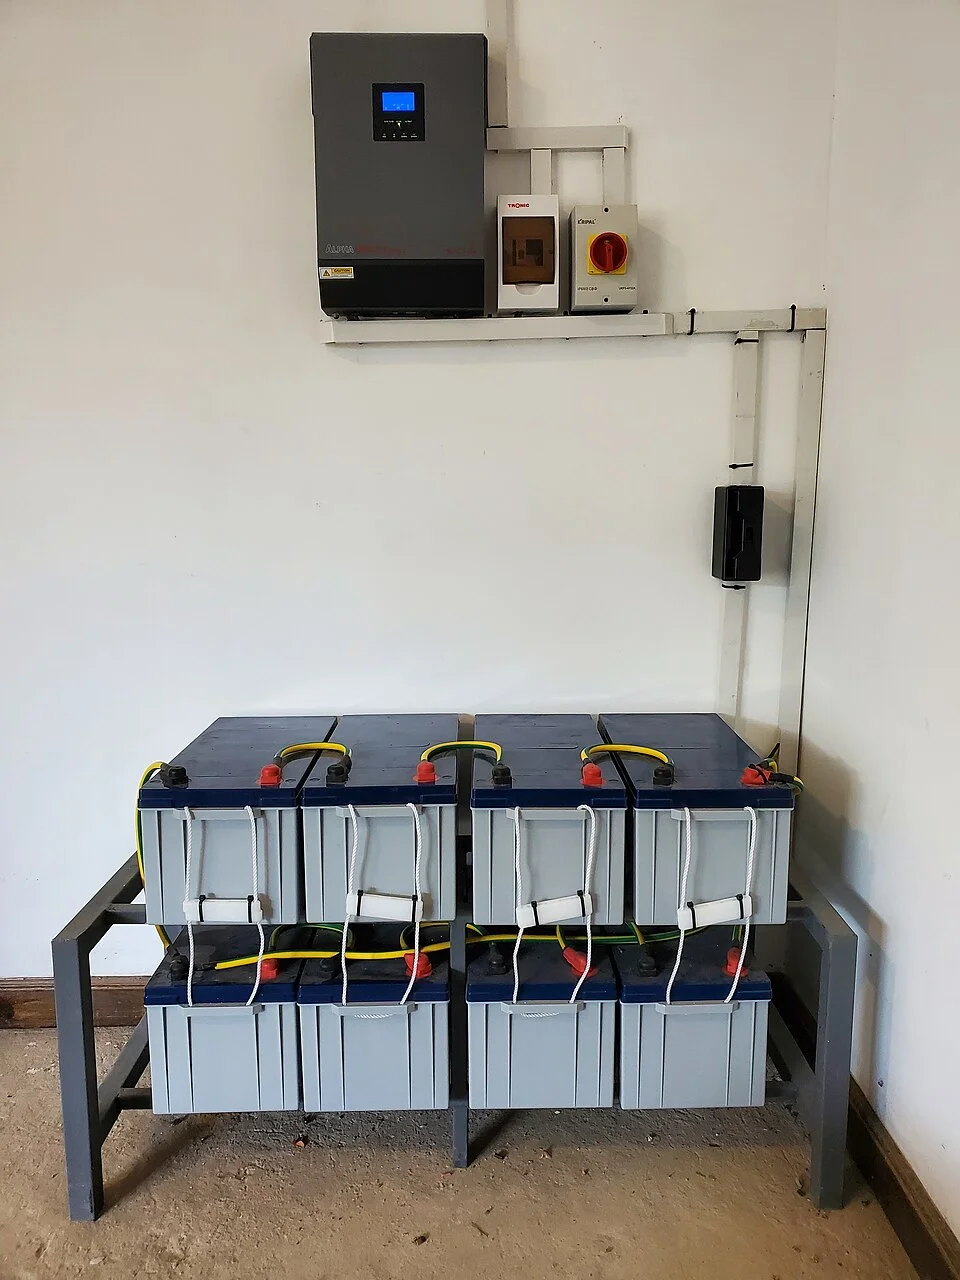
For a planner, the missing figures affect practical decisions. An apparent decline in daytime electricity demand might mean businesses are using less energy, or it might mean that they are meeting more of their needs on site. Those explanations imply different requirements for the hours after sunset. Gigawatts of equipment also tell us little by themselves about how much electricity households actually receive.
The customs trail can help identify places where the conventional count deserves another look. Local installation records, meter information and surveys can then answer questions a border declaration never could, including which businesses have power, which households gained access and how long the lights stay on.