- The researchers compared satellite and ground observations for 2001–2024.
- They estimated that surface dimming offset about 0.125°C of warming per decade.
- The finding concerns a regional trend. Individual heatwaves and local air quality pose different questions.
Inside this story 2 perspectives
A thermometer records the warmth that reaches a place. It cannot record what the reading might have been under a clearer sky. Researchers at India's Vikram Sarabhai Space Centre tried to reconstruct that second number for a region with an apparent puzzle. India experiences severe heatwaves, yet over recent decades its surface has warmed more slowly than several other land areas in the tropics. A briefing issued on 22 September by the journal Ocean-Land-Atmosphere Research explains what particles in the air and the clouds above them may have contributed.
The team combined observations from the ground and from satellites for 2001 to 2024. The measured surface warming trend was about 0.138 degrees Celsius per decade. The authors estimated that a reduction in sunlight reaching the surface offset about 0.125 degrees of warming per decade. In their calculation the regional warming rate would have been nearly twice as large without the dimming. The thermometer still showed warming. The cooling figure describes an influence on that trend.
A shadow seen from space
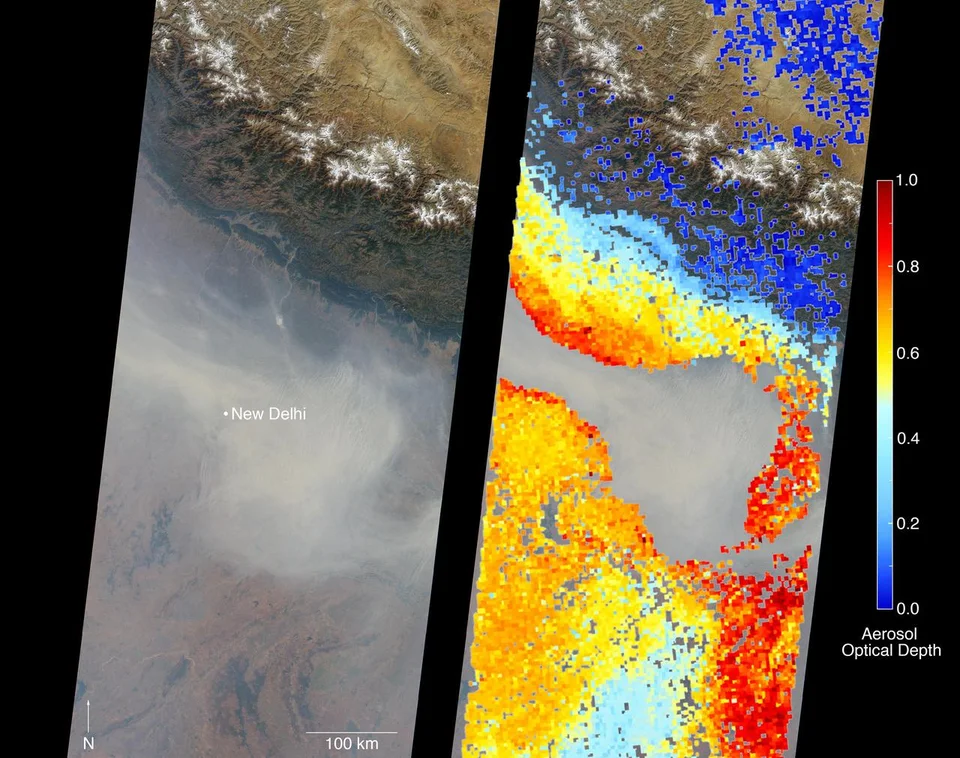
Dust, sea salt and particles from combustion can all hang suspended in the air. NASA's term for one satellite measure, aerosol optical depth, describes how much a column of such material impedes the passage of light. An instrument looking down from orbit can detect the effects of particles all the way through that column. It takes other information to work out how much of the material is near the people walking underneath.
The composition matters too. A bright particle can scatter sunlight back towards space. A dark one can absorb energy and warm the air around it even as it shades the surface below. Small airborne particles also give water vapour places to condense. A change in the number and size of cloud droplets can alter how much light the resulting cloud reflects. Two air samples with similar amounts of suspended material can therefore have different effects on the ground.
A regional average has limits
The team attributed roughly 0.08 degrees Celsius of cooling per decade to cloud cover and roughly 0.04 degrees to aerosols. These are estimates of the effect on a trend over many years. They cannot establish how much hotter a particular afternoon in a particular Indian city would have been. A heatwave and a long-run regional average operate on different calendars and cover different areas.
The composition of the airborne material also changed during the study period. The researchers report that its capacity to cool declined even as the overall aerosol loading increased. That makes prediction more complicated than extending a line on a graph. A forecast of future surface temperatures has to consider what the particles are made of, how their abundance changes and how clouds respond. A single measurement of haziness cannot supply all three answers.