- India’s provisional annual consumer inflation reached 5.54% in September.
- Food inflation rose to 7.74% from 5.97% in August.
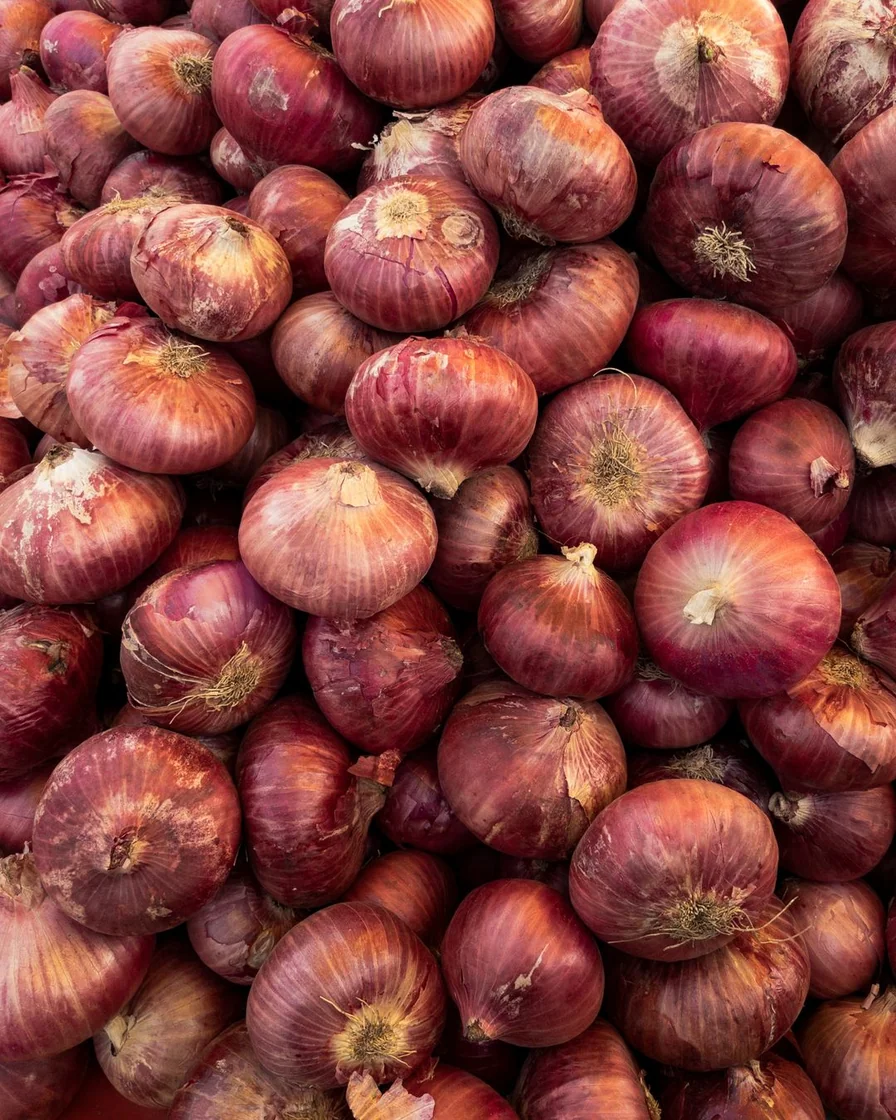
- Potatoes were 11.50% cheaper than a year earlier while onions ranked first on the list of high-inflation items.
Inside this story 2 perspectives
Buy onions and potatoes for the same meal and India’s September price report offers two very different comparisons with last year. Onions led the statistics ministry’s list of items with high annual inflation. Potatoes were 11.50% cheaper than a year earlier on the national combined measure. Both findings sit inside the 5.54% annual consumer inflation rate released on 12 October. Neither alone describes the cost of preparing the meal.
The September figure was provisional and followed 4.83% inflation in August. Food prices rose 7.74% over the year, up from 5.97% in August. For someone who remembers what a few staple ingredients cost last season, the item-level figures reveal why a personal impression of inflation and the national headline can feel so far apart. The shop, the season and the mix of purchases all matter.
A falling price can still lift the annual rate
Take tomatoes. Their price index was 8.62% below its level a year earlier in September. In August it had been 31.09% below the previous August. Tomatoes were still cheaper on a year-on-year basis, but the price decline was much less pronounced. All else equal, a smaller negative contribution leaves the overall inflation rate higher. Reporting only that tomatoes remained cheaper would miss that change.
The two comparisons also have different starting points. August is measured against the previous August and September against the previous September. They cannot tell a shopper on their own how much tomatoes rose or fell between this August and September. To answer that question requires the two index levels or a reported month-on-month change. The distinction is particularly important for produce whose price and availability can move sharply with the season.
What gets a place on the shopping list
The ministry’s high-inflation list also included silver jewellery, ginger and garlic. An expensive piece of jewellery and a few cloves of garlic may show large percentage changes for completely different reasons and turn up in household spending with very different frequency. The index attaches weights so that a large change in a small category does not stand in for a large change across the basket.
Rural consumer inflation was 6.08%, compared with 4.88% in urban areas. Even those separate averages conceal variation among shoppers. Someone who grows part of the family’s food, buys different vegetables or needs to make an unusual purchase this month will encounter a different mix of price movements. The national measure remains valuable for comparing broad changes over time. Reading its item tables alongside a real grocery list makes clearer which part of that change is reaching a particular kitchen.